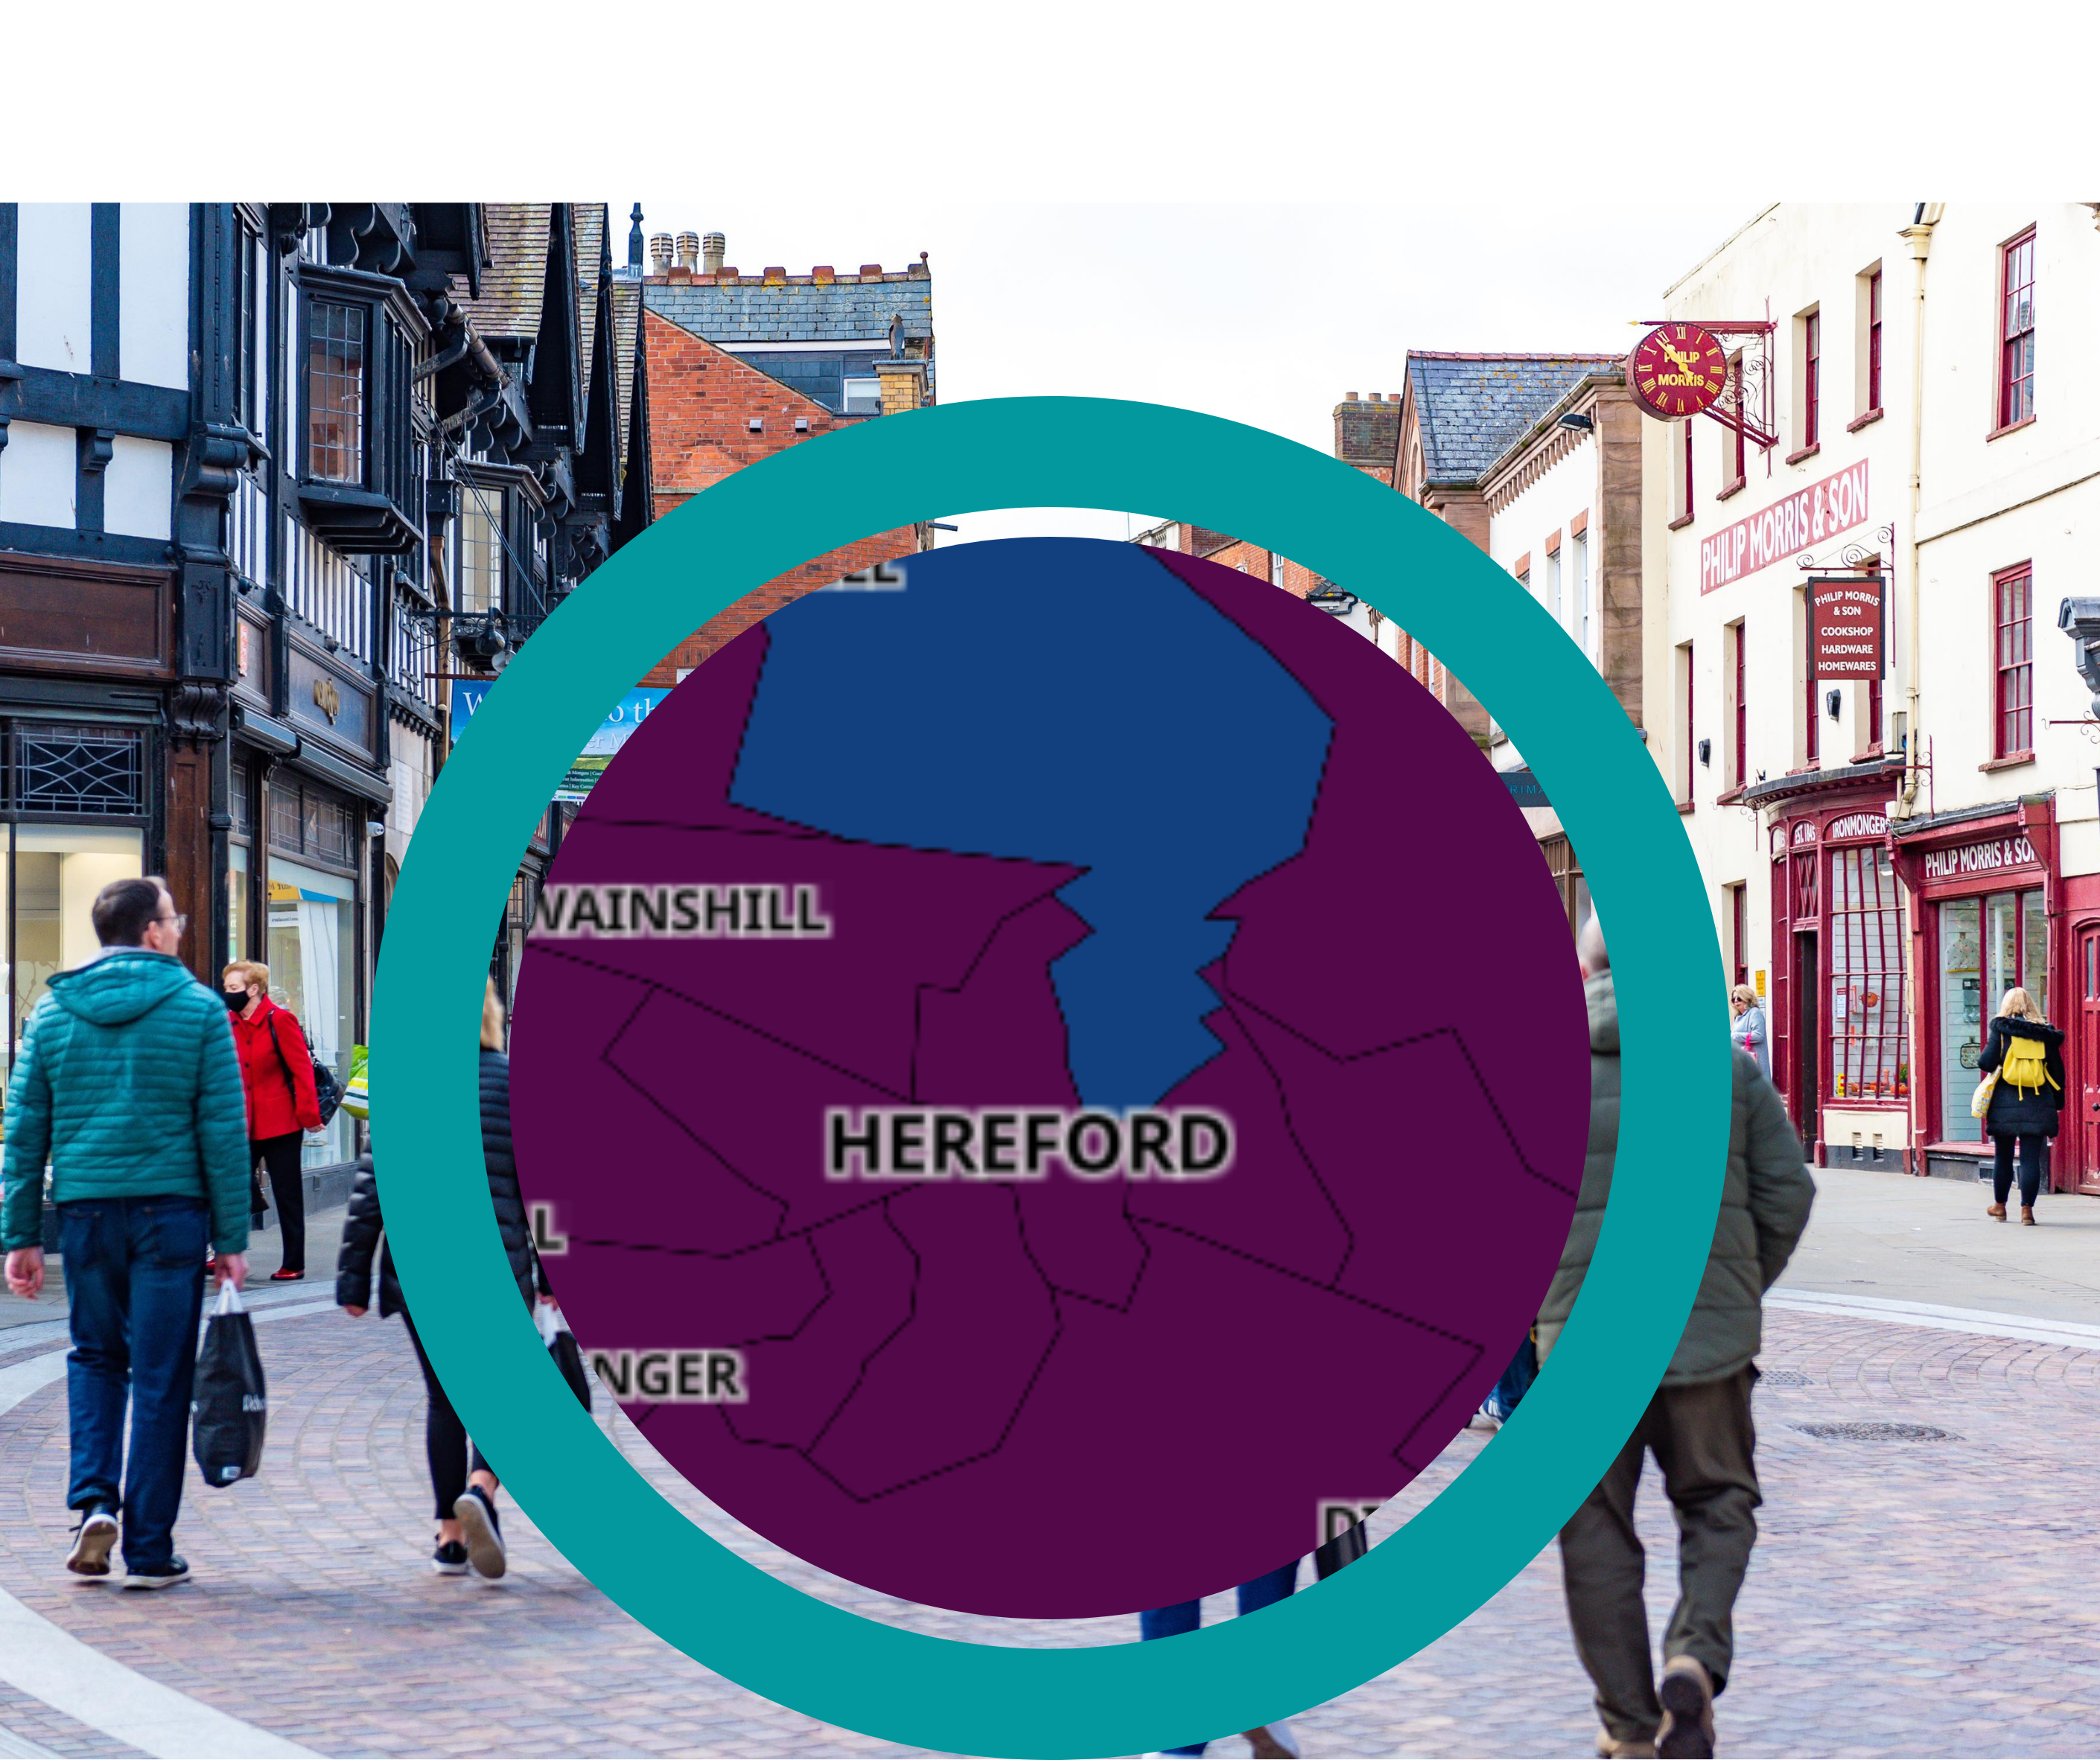
The Tupsley (Hereford East) area of Hereford currently has the highest infection rate in the county, with an infection rate of 634.3 cases per 100,000 population.
Infection rates continue to rise across the county, with the Lugwardine, Withington & Moreton on Lugg area recording the second highest infection rate in Herefordshire, with a rate of 612.7 cases per 100,000 population recorded in the seven day period ending 21st August. This is up by over 50% on the previous seven day period.
Several areas in Herefordshire now have a COVID-19 infection rate above 400 cases per 100,000 population. These are detailed below:
Areas of Herefordshire with a COVID-19 infection rate above 400 cases per 100,000 population in the seven day period ending 21st August
Hereford East – 38 new cases (Infection rate of 634.3 cases per 100,000 population)
Lugwardine, Withington & Moreton on Lugg – 47 new cases (Infection rate of 612.7 cases per 100,000 population)
Fownhope, Tarrington & Marcle – 29 new cases (Infection rate of 422.7 cases per 100,000 population)
Kingstone & Kingsthorne – 48 new cases (Infection rate of 425.9 cases per 100,000 population)
Belmont, Madley & Clehonger – 33 new cases (Infection rate of 486.8 cases per 100,000 population)
Credenhill, Weobley & Wellington – 42 new cases (Infection rate of 437 cases per 100,000 population)
Hereford North West – 43 new cases (Infection rate of 462.7 cases per 100,000 population)
Hereford West – 41 new cases (Infection rate of 571.5 cases per 100,000 population)
Hereford Central – 51 new cases (Infection rate of 506.6 cases per 100,000 population)
Hereford South West – 40 new cases (Infection rate of 483.7 cases per 100,000 population)
Hereford South – 40 new cases (Infection rate of 409 cases per 100,000 population)
The vast majority of these new cases are being recorded in the 15-19 year-old and 20-24 year-old age groups, with approximately 1 in 37 teenagers aged between 15-19 testing positive for COVID-19 in the seven day period ending 21st August.
Source: Interactive map of cases | Coronavirus in the UK (data.gov.uk)


