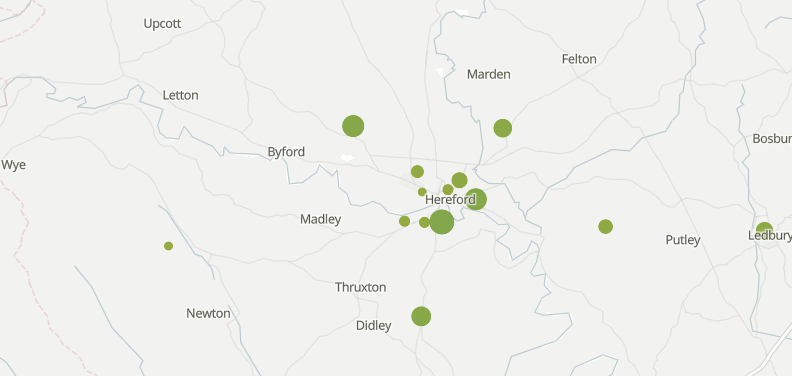
The Office for National Statistics has released data today showing a breakdown of COVID-19 related deaths in each area of Herefordshire.
It comes as data released by the Office for National Statistics shows that over 100,000 COVID-19 related deaths have now occurred.
The coronavirus (COVID-19) has spread across the vast majority of neighbourhoods in England and Wales. The interactive map allows you to see the number of deaths registered in the period March to December 2020, where COVID-19 was the underlying (main) cause on the death certificate.
As local data is only available up to December, the numbers of deaths in the map will not reflect the latest trends. In particular, patterns may not reflect those seen in the most recent case numbers, as a death from COVID-19 will be reported some time after a positive test. January data will be added to the map on 18 February 2021.
WEEKLY BULLETIN
- The number of deaths registered in England and Wales in the week ending 15 January 2021 (Week 2) was 18,042, 291 more deaths than in the previous week (Week 1); this is the fourth-highest number of weekly deaths recorded during the coronavirus (COVID-19) pandemic.
- In Week 2, the number of deaths registered was 30.5% above the five-year average (4,220 deaths higher).
- Of the deaths registered in Week 2, 7,245 mentioned “novel coronavirus (COVID-19)”, the third-highest weekly number recorded during the pandemic and an increase of 1,188 deaths compared with Week 1.
- In Week 2, deaths involving COVID-19 accounted for 40.2% of all deaths in England and Wales; this is the highest proportion of deaths involving COVID-19 that has been recorded during the pandemic.
- Of the 7,245 deaths involving COVID-19, 6,510 had this recorded as the underlying cause of death (89.9%).
- Of the 5,273 deaths that involved Influenza and Pneumonia, 381 had this recorded as the underlying cause of death (7.2%).
- In England, the total number of registered deaths increased from 16,527 (Week 1) to 16,845 (Week 2), the fifth-highest total recorded during the pandemic; all English regions had a higher number of deaths than the five-year average for the 10th week in a row.
- In Week 2, the number of registered deaths involving COVID-19 increased in eight out of nine English regions compared with Week 1, with the South East and East of England recording their highest weekly numbers of deaths involving COVID-19.
- In Wales, the total number of registered deaths in Week 2 was 314 higher than the five-year average; total deaths in Wales have exceeded the first wave peak of 1,169 deaths recorded in Week 16 (week ending 17 April 2020) for two weeks in a row.
- In Wales, the number of registered deaths involving COVID-19 increased from 454 (Week 1) to 467 (Week 2), the highest recorded at any point during the pandemic.
- We estimate that the number of deaths actually occurring (rather than registered) in Week 2 in England and Wales was between 17,847 and 22,626.
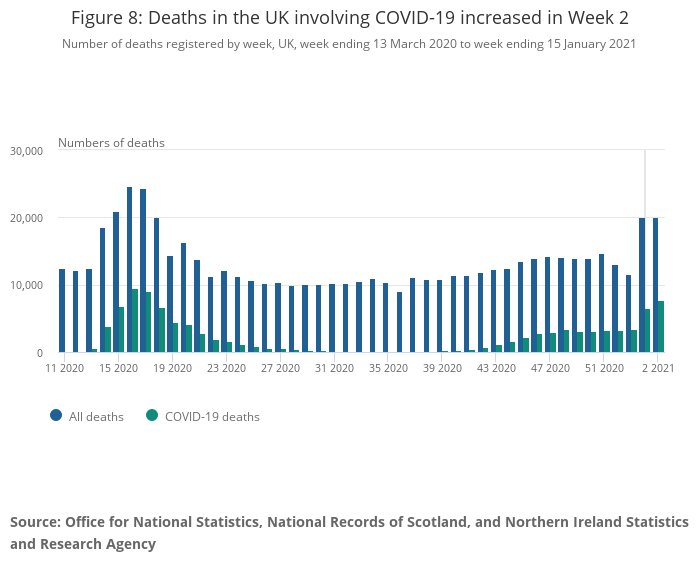
- The number of deaths registered in the UK in the week ending 15 January 2021 was 20,019, which was 4,347 higher than the five-year average; of deaths registered in the UK in Week 2, 7,766 deaths involved COVID-19, 1,173 higher than in Week 1.
Figure 1: The number of deaths was above the five-year average in Week 2
Number of deaths registered by week, England and Wales, 28 December 2019 to 15 January 2021
Figure 2: The number of deaths involving COVID-19 increased in Week 2
Deaths involving and due to COVID-19 and Influenza and Pneumonia, England and Wales, deaths registered in 2020 and 2021
Figure 3: Deaths not involving COVID-19 were below the five-year average in Week 2
Number of deaths registered by week, England and Wales, 28 December 2019 to 15 January 2021
Figure 4: Nearly three-quarters of all deaths involving COVID-19 have been in people aged 75 years and over
Number of deaths involving COVID-19 by sex and age group, England and Wales, registered between 28 December 2019 and 15 January 2021
Figure 5: The number of deaths in Week 2 was higher than the five-year average in all English regions and Wales
Number of deaths in Wales and regions in England, registered between 28 December 2019 and 15 January 2021
Figure 6: Deaths were above the five-year average in all locations in Week 2
Number of excess deaths by place of occurrence, England and Wales, registered between 7 March 2020 and 15 January 2021
Figure 7: Nearly 75% of deaths involving COVID-19 occurring in Week 2 were in hospital
Number of deaths involving COVID-19 by place of occurrence, England and Wales, occurring up to 15 January 2021 and registered up to 23 January 2021
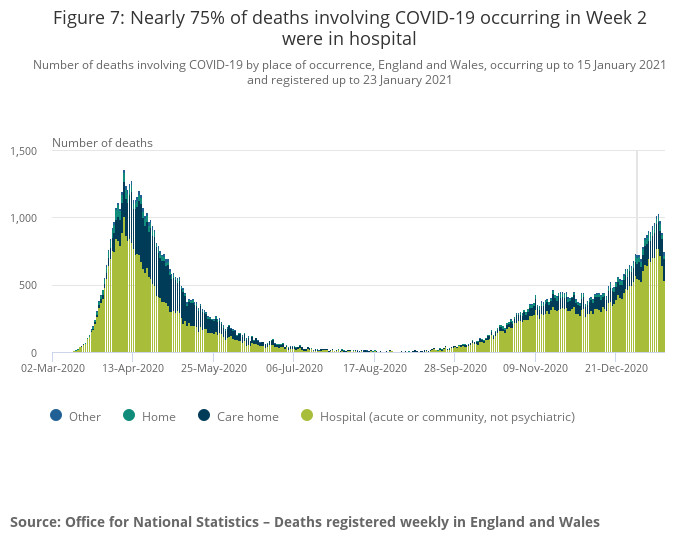
Figure 8: Deaths in the UK involving COVID-19 increased in Week 2
Number of deaths registered by week, UK, week ending 13 March 2020 to week ending 15 January 2021