
COVID-19 has spread across the vast majority of neighbourhoods in England and Wales. This interactive map from the Office for National Statistics allows you to see the number of deaths registered in the period March to December 2020, where COVID-19 was the underlying (main) cause on the death certificate.
As local data is only available up to December, the numbers of deaths in the map will not reflect the latest trends. In particular, patterns may not reflect those seen in the most recent case numbers, as a death from COVID-19 will be reported some time after a positive test. January data will be added to the map on 18 February 2021.
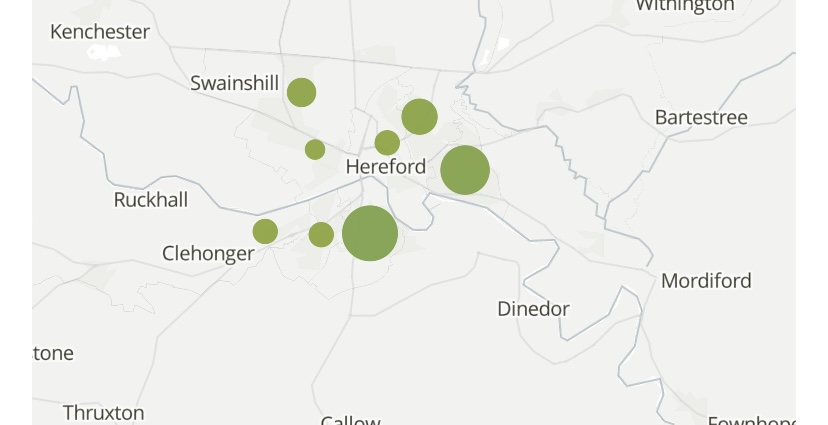
Enter your postcode or interact with the map to see the number of deaths in an area. The size of the circle represents the number of deaths.
More information – https://www.ons.gov.uk/peoplepopulationandcommunity/healthandsocialcare/causesofdeath/articles/deathsinvolvingcovid19interactivemap/2020-06-12
Contains public sector information licensed under the Open Government Licence v3.0.