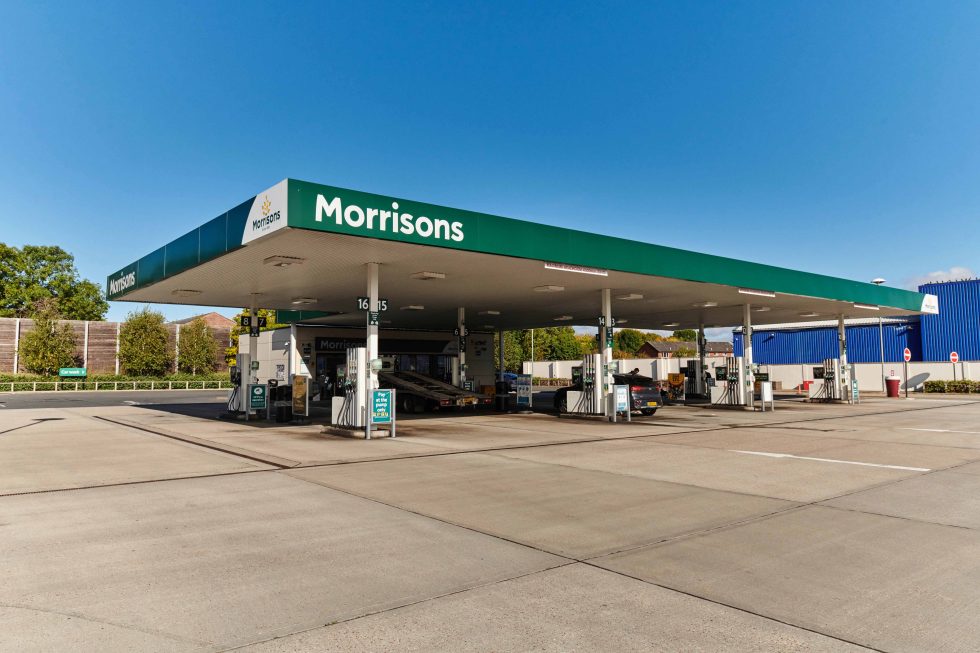
The price of petrol rocketed by nearly 7p (6.68p) a litre in August while diesel shot up by 8p, making for the fifth and sixth biggest monthly rises in 23 years, data from RAC Fuel Watch* shows.
The average price of unleaded finished August at 152.25p – up from 145.57p at the beginning of the month, adding nearly £4 to a tank (£80 to £83.74). Diesel went up from 146.36p to 154.37p, making a fill-up nearly £4.50 (£4.41) more expensive.
For petrol, the monthly price rise was only exceeded by March (11.61p), May (11.15p) and June 2022 (16.59p), after Russia’s invasion of Ukraine, and October 2021 (7.43p).
Diesel’s increase was also surpassed by March (22.06p), June (15.62p) and October (10.14p) last year, as well as by October 2021 (8.16p) and May 2008 (8.43p) which was shortly before oil hit its record high price of $144 a barrel.
The rising prices at the pumps have been caused by the increasing cost of oil, which has gone up nearly $12 since the start of July to nearly $87 ($86.86) a barrel now, due to producer group OPEC+ reducing supply.
This led to the wholesale cost of fuel – the price retailers pay – going up, which in turn has been passed on to drivers on the forecourt. Whether prices continue to go up in the coming weeks remains to be seen, with concerns about the health of the Chinese economy and the end of the summer driving season in the United States both having the potential to limit further rises.
RAC fuel spokesman Simon Williams said:
“August was a big shock to drivers as they had grown used to seeing far lower prices than last summer’s record highs.
“Seeing £4 or more go on to the cost of a tank in the space of just a few weeks from a pump price rise of 6-7p a litre is galling, particularly for those who drive lots of miles or run an older, less fuel-efficient car.
“While the increase is clearly bad news for drivers, it could have been far worse had the biggest retailers not let their inflated margins from earlier in the year return to more normal levels as wholesale fuel costs went up.
“Wholesale costs for both petrol and diesel started to rise in late July on the back of oil hitting $85. While the barrel price has stayed at that level throughout August, retailers had no choice but to pass on their increased costs at the pumps.
“Fortunately for drivers though, they have clearly been influenced by the Competition and Markets Authority’s investigation as, all of a sudden, margins are once again closer to their longer-term averages.
“It appears they used the wholesale price rise to subtly cover their tracks – after all, big reductions at the pumps soon after the CMA’s findings were announced would perhaps have been far too obvious a step.
“All we can hope is that this move by many big retailers back to fairer forecourt pricing remains when wholesale costs go down again. Only time will tell.
“That said, fuel prices in Northern Ireland are still lower than on this side of the Irish Sea with petrol at an average of 149.5p and diesel at 151.6p, however the gap has shrunk by around 2p a litre in a month which is much better news all round. Petrol is now only 1.5p cheaper in Northern Ireland while diesel is 2p less.”
Drivers looking to get the best possible value at the pumps should download the free myRAC app from the App Store or Google Play and start using the Fuel Finder feature as it can lead to savings of up to 6p a litre – or as much as £3.30 for every full 55-litre tank**.
Up to five searches can be made a day over a two, five or 10-mile radius from users’ chosen locations, with each giving the five cheapest sites. The app also displays UK average prices for both petrol and diesel making it easy to compare against local forecourts.
Drivers who want to monitor prices more widely should visit RAC Fuel Watch where they can see the average price of petrol and diesel at the big four supermarkets and at motorway services. There are also graphs showing average prices since 2000 as well as a daily financial breakdown of the cost of a litre of petrol and diesel.
Regional pump prices
| Unleaded – pence per litre | 01/08/2023 | 31/08/2023 | Change | End of month variance to UK avg |
| UK average | 145.57 | 152.25 | 6.68 | |
| East | 146.38 | 152.72 | 6.34 | 0.47 |
| East Midlands | 145.28 | 152.01 | 6.73 | -0.24 |
| London | 146.81 | 153.09 | 6.28 | 0.84 |
| North East | 144.25 | 150.76 | 6.51 | -1.49 |
| North West | 144.38 | 150.95 | 6.57 | -1.3 |
| Northern Ireland | 141.33 | 149.51 | 8.18 | -2.74 |
| Scotland | 145.32 | 152.22 | 6.9 | -0.03 |
| South East | 147.15 | 153.74 | 6.59 | 1.49 |
| South West | 146.56 | 152.91 | 6.35 | 0.66 |
| Wales | 144.69 | 151.90 | 7.21 | -0.35 |
| West Midlands | 145.40 | 152.41 | 7.01 | 0.16 |
| Yorkshire and The Humber | 144.77 | 151.40 | 6.63 | -0.85 |
| Diesel – pence per litre | 01/08/2023 | 31/08/2023 | Change | End of month variance to UK avg |
| UK average | 146.36 | 154.25 | 7.89 | |
| East | 146.70 | 154.78 | 8.08 | 0.53 |
| East Midlands | 146.50 | 154.12 | 7.62 | -0.13 |
| London | 147.62 | 155.20 | 7.58 | 0.95 |
| North East | 145.29 | 152.92 | 7.63 | -1.33 |
| North West | 145.43 | 152.70 | 7.27 | -1.55 |
| Northern Ireland | 141.87 | 151.64 | 9.77 | -2.61 |
| Scotland | 146.09 | 154.65 | 8.56 | 0.4 |
| South East | 147.99 | 156.10 | 8.11 | 1.85 |
| South West | 147.37 | 154.98 | 7.61 | 0.73 |
| Wales | 145.62 | 154.26 | 8.64 | 0.01 |
| West Midlands | 146.48 | 154.50 | 8.02 | 0.25 |
| Yorkshire and The Humber | 146.84 | 154.60 | 7.76 | 0.35 |


