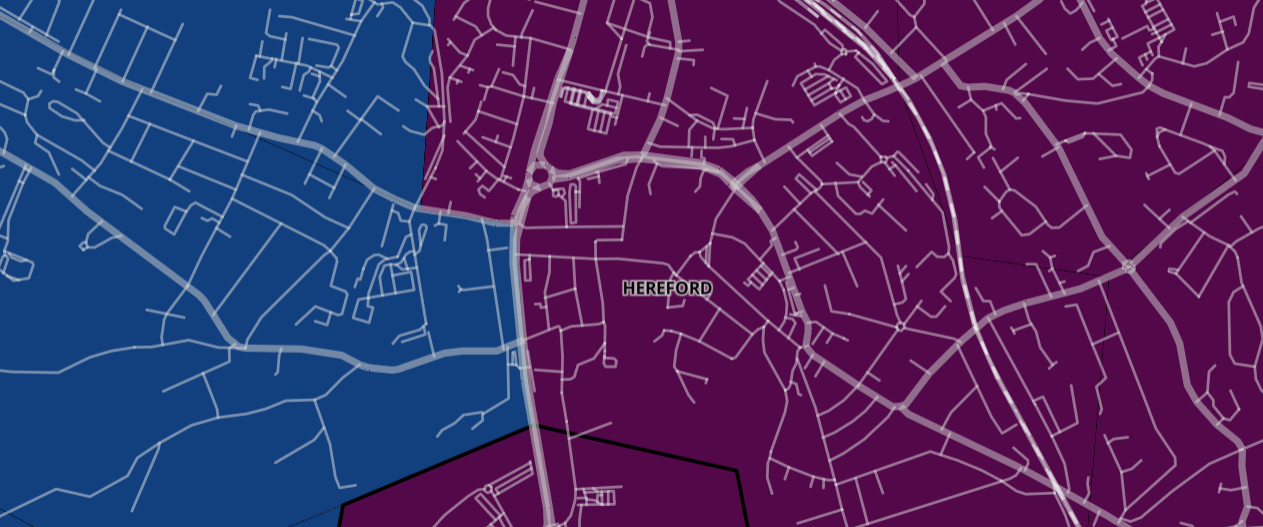
COVID-19 infection rates are continuing to rise across much of Herefordshire but the worst affected area at the moment is Hereford city.
Now that won’t come as much of a surprise to some due to Hereford being the most densely populated area of the county, however what is concerning local health officials is how fast the infection rates are rising, alongside increasing admissions to hospital.
COVID-19 INFECTION RATES IN HEREFORD CITY:
HEREFORD NORTH EAST (Including Aylestone Hill, North of Roman Road and areas such as Shelwick and Munstone)
Infection rates in this area are the highest in Hereford. In data up until 1st January, this area of Hereford saw an infection rate of 709.7 cases per 100,000 population. This is significantly UP on data up until 4th December when this area of the city had an infection rate of 77.4 cases per 100,000 population.
HEREFORD CENTRAL (Including Edgar Street, Widemarsh Street, City Centre, Barrs Court Road and College)
Infection rates in this area of Hereford are rapidly rising. In data up until 1st January, this area of Hereford saw an infection rate of 546.3 cases per 100,000 population. This is significantly UP on data up until 4th December when this area of the city had an infection rate of 79.5 cases per 100,000 population.
HEREFORD EAST (Including Tupsley and Hampton Park Road)
Infection rates in this area of Hereford are rapidly rising. In data up until 1st January, this area of Hereford saw an infection rate of 550.8 cases per 100,000 population. This is significantly UP on data up until 4th December when this area of the city had an infection rate of 83.5 cases per 100,000 population.
HEREFORD NORTH WEST (Including Grandstand Road, Yazor Road and Three Elms)
Infection rates in this area of Hereford are rising but not as fast as in other areas of the city. In data up until 1st January, this area of Hereford saw an infection rate of 279.8 cases per 100,000 population. This is significantly UP on data up until 4th December when this area of the city had an infection rate of 75.3 cases per 100,000 population.
HEREFORD WEST (Including Westfaling Street and parts of Whitecross)
Infection rates in this area of Hereford are rising steadily. In data up until 1st January, this area of Hereford saw an infection rate of 390.3 cases per 100,000 population. This is significantly UP on data up until 4th December when this area of the city had an infection rate of 83.6 cases per 100,000 population.
HEREFORD SOUTH WEST (Including Hunderton, Newton Farm and The Oval)
Infection rates in this area of Hereford are rapidly rising. In data up until 1st January, this area of Hereford saw an infection rate of 314.4 cases per 100,000 population. This is significantly UP on data up until 4th December when this area of the city had an infection rate of 48.4 cases per 100,000 population.
HEREFORD SOUTH (Including Hinton, Putson and parts of Redhill)
Infection rates in this area of Hereford are rapidly rising. In data up until 1st January, this area of Hereford saw an infection rate of 480.6 cases per 100,000 population. This is significantly UP on data up until 4th December when this area of the city had an infection rate of 81.8 cases per 100,000 population.
IMAGE CREDIT: OpenMapTiles (Open Street Map Contributors)


