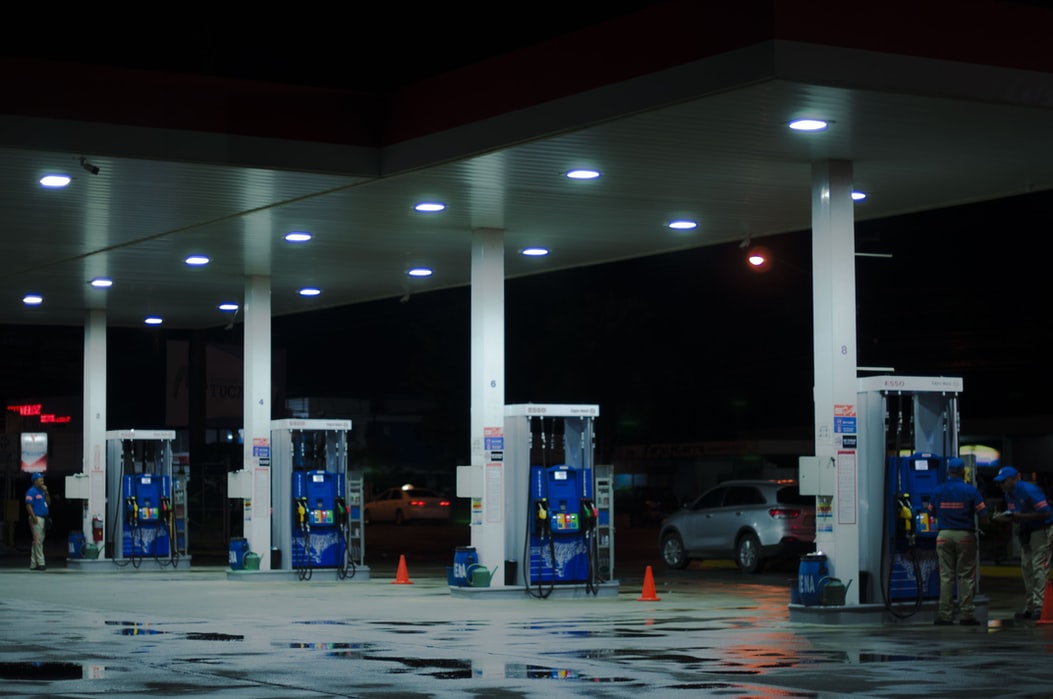
Drivers are facing relentless rises in the price of petrol and diesel at UK forecourts this summer after another 3.4p and 2.7p were added to a litre of each respective fuel in July, new RAC Fuel Watch figures show.*
Last month saw the largest rise in the price of unleaded since January and means on average a litre now costs 135.13p – a price not seen since late September 2013 – up from 131.76p at the start of the month. Diesel meanwhile now costs on average 137.06p per litre, up from 134.36p. The price rises meant that last month was the most expensive July to fill up with petrol since 2013, and for diesel since 2014.
A driver filling up a 55-litre car with petrol now pays on average £3.08 more to fill up than they did at the start of June, and £11.47 more than they did a year ago. The picture is barely better for diesel drivers; filling a similarly sized tank now costs £2.90 more than at the start of June, and £10.46 more than it did at the end of July 2020.
With confidence building of a global recovery from the coronavirus pandemic – buoyed by progress in worldwide vaccination programmes, an easing of restrictions in many places and increases in travel and other commercial activity – demand for oil is increasing. Although there was little overall change in the oil price from the start to the end of July, it did nearly touch the $80 a barrel mark near the beginning of the month. As demand for oil outstrips supply, wholesale fuel prices are pushed up and drivers feel the effect every time they fill up.
Drivers should continue to visit supermarkets to find the best value fuel this summer. The prices of a litre of petrol is around 3p cheaper compared to the average (132.34p compared to 135.13p) and more than 16p less than at motorway service areas (132.34p compared to 148.78p).
RAC fuel spokesman Simon Williams said:
“Prices really are only going one way at the moment – and that’s not the way drivers want to see them going. With a second summer staycation in full swing, it’s proving to be a particularly costly one for many families who are using their cars to holiday here in the UK. With so many people depending on their vehicles, there’s really nothing drivers can do to escape the high prices, and our best advice is for them to drive as economically as possible in order to try to make their money go further.
“Right now it’s hard to see what it will take for prices to start falling again. While we’re not past the pandemic by any means, demand for oil is likely to continue to increase as economic activity picks up again, and this is likely to have the effect of pushing up wholesale fuel prices, costs which retailers are bound to pass on at the pumps. Unless major oil producing nations decide a new strategy to increase output, we could very well see forecourt prices going even higher towards the end of the summer.
“If there is any good news at all, it is that prices would need to rise significantly further – by a further 3p – to reach the highest prices we saw in 2013. But that’s no comfort for the millions of drivers who are faced with paying so much more for fuel than they have done in many years.
“Drivers planning to change their vehicles in the coming months would do well to consider an electric model, where running costs are so much lower. Even upfront costs are now become much more affordable, and with the RAC’s new EV lease scheme motorists can currently get into a brand new zero-emission 40kW Nissan Leaf for just £227.99 a month, after paying a small initial rental payment.”
Regional pump prices compared
| Unleaded | 01/07/2021 | 31/07/2021 | Change |
| East Midlands | 131.08 | 134.79 | 3.71 |
| West Midlands | 131.52 | 135.22 | 3.70 |
| North West | 131.24 | 134.76 | 3.52 |
| Yorkshire And The Humber | 130.66 | 134.15 | 3.49 |
| East | 132.26 | 135.71 | 3.45 |
| South West | 132.26 | 135.64 | 3.38 |
| North East | 130.53 | 133.88 | 3.35 |
| Scotland | 131.51 | 134.76 | 3.25 |
| South East | 132.84 | 135.85 | 3.01 |
| Wales | 131.27 | 134.19 | 2.92 |
| Northern Ireland | 128.55 | 131.40 | 2.85 |
| London | 133.13 | 135.86 | 2.73 |
| Diesel | 01/07/2021 | 31/07/2021 | Change |
| West Midlands | 134.39 | 137.46 | 3.07 |
| East | 134.96 | 138.00 | 3.04 |
| Wales | 133.48 | 136.40 | 2.92 |
| South West | 134.77 | 137.64 | 2.87 |
| East Midlands | 134.14 | 136.97 | 2.83 |
| Scotland | 134.24 | 137.04 | 2.80 |
| Yorkshire And The Humber | 133.83 | 136.61 | 2.78 |
| South East | 135.53 | 138.20 | 2.67 |
| North West | 133.98 | 136.64 | 2.66 |
| North East | 133.17 | 135.82 | 2.65 |
| London | 135.33 | 137.89 | 2.56 |
| Northern Ireland | 130.29 | 132.50 | 2.21 |


